This project aims at reproducing part of the experiment conducted by Pawan Sinha and Tomaso Poggio in 1996, that was described in the article Role of learning in three dimensional form perception.
Table of contents:
- Description of the original experiment
- Quick overview of the computation
- How to run the scripts
- Discussion
In the original experiment, Sinha and Poggio studied the role of learning in shape perception. To do so, they created several 3D shapes by randomly bending a 3D wire. This shape was rotating around an axis, and participants could see it projected on the screen. After seeing the projection, they had to say whether or not the shape seemed rigid. Two sets of shapes (A and B) were created, and the participants were randomly assignated to one of three groups:
- Group 1: The participants underwent a training session with the set of images A, then a testing session with the set of images B.
- Group 2: The participants only had a training session with either the set of images A or the set of images B.
- Group 3: The participants underwent a training session with the set of images B, then a testing session with the set of images A.
Sinha and Poggio showed that the participants reported non-rigidity less often during the training session than during the testing session, which suggests that the visual experience shapes the perception of 3D-form.
This illusion is cited as an example by Sinha and Poggio: by creating a shape and making it rotate accordingly, one can have the feeling that it is a man walking in 2D rather than a 3D shape rotating.
In order to project 3D shapes on a plane, one first defines this plane through its normal vector, which is characterized by two angles alpha and beta:

Fig. 1: The angle alpha goes from the x-axis to the projection of the normal vector on the xy-plane. The angle beta goes from this projection to the normal vector.
Then the points are projected on the plane with succesive transformation matrices.
To reproduce the illusion that the figure rotates and the projection plane stays still, one moves the projection plane around the rotation axis of the figure.
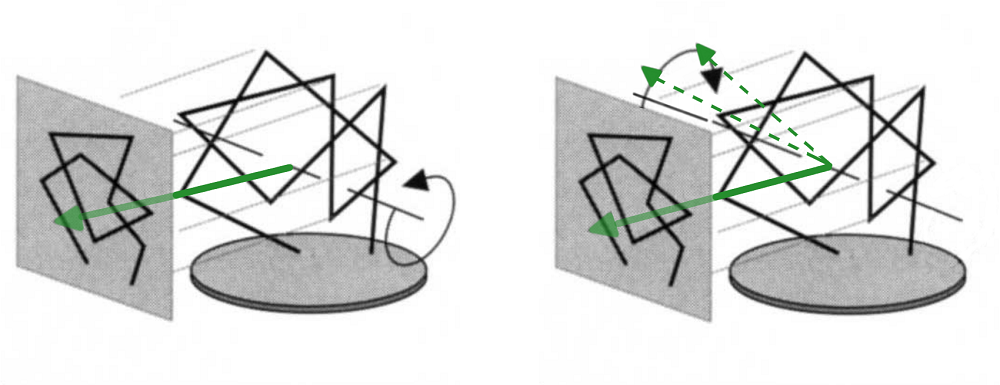
Fig. 2: Green vectors represent the vectors normal to the plane. Green dotted vectors represent other position of the normal vector while the plane rotates around the axis. Left: the figure rotates while the plane doesn't move. Right: the plane rotates while the figure doesn't move.
Please download the files custom_functions.py, exp1.py, analyse_data_exp1.py and illusion.py, as well as the folder example_data_exp1, and make sure you keep the following architecture:
├─ custom_functions.py
├─ exp1.py
├─ analyse_data_exp1.py
├─ illusion.py
└─ example_data_exp1/
   ├─ exp1_subject_1.xpd
   ├─ exp1_subject_2.xpd
   └─ ...
To properly run this project, please make sure that the following modules are installed on your computer:
- sys
- os
- numpy
- pandas
- math
- expyriment
- matplotlib
To launch exp1.py, simply use the command:
python exp1.pyYour group will be attributed depended on the value of subject ID you choose in the beginning.
When you run exp1.py, two folders are created: data and event. Your architecture should then be:
├─ custom_functions.py
├─ exp1.py
├─ analyse_data_exp1.py
├─ illusion.py
├─ example_data_exp1/
│  ├─ exp1_subject_1.xpd
│  ├─ exp1_subject_2.xpd
│  └─ ...
├─ data/
│  ├─ exp1_01_date.xpd
│  ├─ exp1_02_date.xpd
│  └─ ...
└─ event/
   └─ ...
- If you want to analyse your own data, use the command:
python analyse_data_exp1.py dataIf you changed the name of the folder containing the data, just put the new name instead of data.
The script will display two figures analysing your data, and register them in your folder with the name data_answers_by_group_and_set.png and data_answers_by_type_of_block.png.
If you want to customize the name of your figures (to save different versions of the figures without changing the name of data for example), use the command:
python analyse_data_exp1.py data custom_nameThe figures will now be saved as datacustom_name_answers_by_group_and_set.png and datacustom_name_answers_by_type_of_block.png.
- If you don't have data to analyze, you can test the script on fictitious data:
python analyse_data_exp1.pyThis command will simply use the fictitious data that are contained in the folder example_data_exp1.
Here are the resulting figures:

Fig. 3: Proportion of structures that were judged rigid with the standard deviation calculated across subjects, divided by group and set of images. Here, structures that were presenting during the training phase were more likely to be judged rigid than structures presented during the testing phase.

Fig. 4: Proportion of structures that were judged rigid with the standard deviation calculated across subjects, depending on the type of block during which they were presented. Here, structures that were preenting during the training phase were more likely to be judged rigid than structures presented during the testing phase.
To launch illusion.py, simply use the command:
python illusion.pyThis will display a 3D structure which, when rotating, gives the impression that this is a 2D drawing of a walking man instead of a 3D rotating structure.
Further improvements could consist in:
- Fixing the rescaling of the structures that doesn't fully work in full screen
- Fixing the warning that appears after running
illusion.py - Implementing the second experiment of Sinha and Poggio, by changing the rotating axis between groups
- Performing the analysis on this experiment
- Implementing the second illusion evoked by Sinha and Poggio
- Presenting the experiment to different participants in order to collect real data
I use Python for four years, and I have done several projects with it (for personal or scholar purposes). I especially had to conduct two projects in machine learning and deep learning that had me learn a lot about the dedicated modules.
With this project, I learned to use the module expyriment, as well as Git and GitHub with which I was very unfamiliar. Maybe a full course about expyriment could have been a plus, since it is a bit hard to take in hand.