Website: User's Guide
The Dashboard
The Device Information Page
Creating an Account
Logging in
View a Device's Details
Open/Close a Device
Lock/Unlock a Device
View a Device's Sensor Graphs
Download a Device's Image
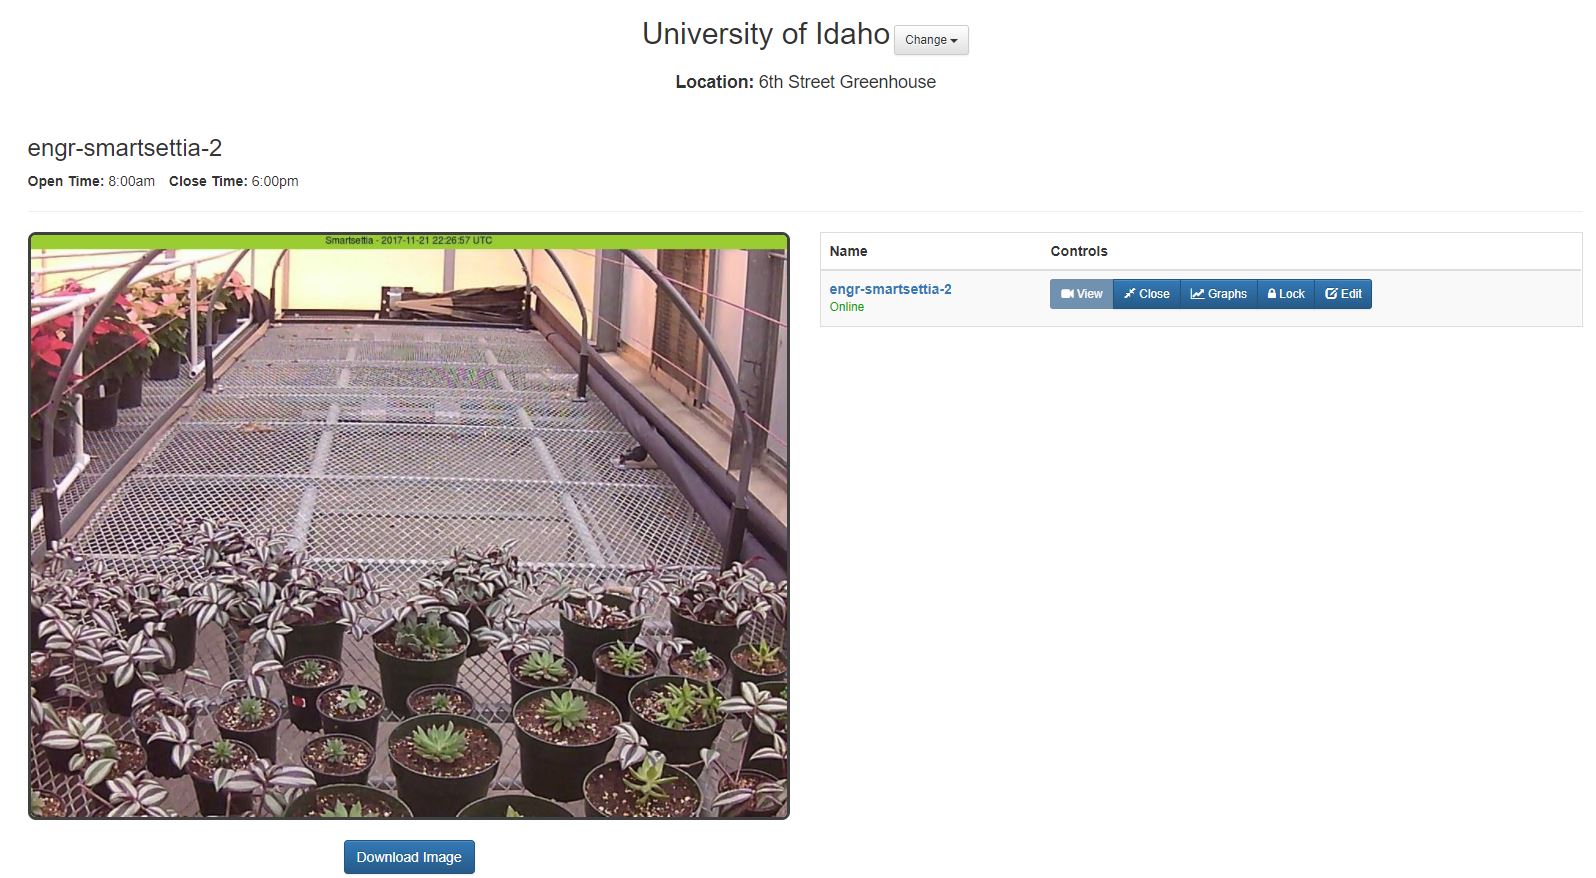
The dashboard page will be the main page you will use to interact with your connected devices. The dashboard displays many pieces of import info including your currently selected site, selected location, selected device details, and device list. Your assigned role will dictate which actions you can see/perform on the dashboard.
Sites and the locations can be defined to represent different things. If multiple companies are using the same website then the site can be used to represent each company while the location can represent a physical location for that company. If one company is using the entire website then site and location may represent smaller entities. For example, site may be used to represent specific buildings on a company’s property while the locations could represent specific rooms or locations in the specified building.
Located at the top of the dashboard is the currently selected site. In the following image, the currently selected site is the University of Idaho. Located to the right of the site is a dropdown menu that allows you to switch between your created sites. If there are no other sites created then this dropdown menu will not be shown.
Located beneath the site is the currently selected location. In the following image, the currently selected location is the 6th Street Greenhouse. As can be seen there is no dropdown menu being shown next to the location. This is because the current site only contains the currently selected location. If there were more locations then the dropdown menu would be displayed to you.

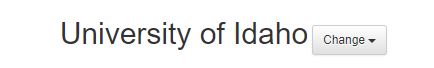
Underneath the location is the selected device details. Firstly, you will see the selected devices name like in the image below the selected device is engr-smarsettia-2. Beneath the device’s name is the currently selected open and close times for the covering system displayed in the user’s selected time zone. Next, we have the devices current image beneath the open and close time. This image will update based on the image rate setting on the edit device page. If the device stops updating its image then you will see an alert bar on the bottom of the image informing you the device image is stale. This will only be shown if the device misses three image updates based on the image rate and an added minute has passed. Located below the image is a button that will allow you to download the currently displayed image.
Lastly to the right or beneath the device details (depending if you are on a computer or smartphone) you will see the device table. The device table will list all devices belonging to the selected location. In the image below the selected location only contains one device. The first column of the device table displays the device’s name followed by the device’s status. The device’s status will display the text Online if the device is still communicating with the server or Last seen followed by the time the device last communicated with the server. The Last seen text will be shown if the device misses three updates based on its update rate and an added minute. The second column displays the device’s controls. From right to left we have the View button that allows you to select a device that will display the device’s details on the dashboard as explained in the Device Details section. Next is the device’s Open/Close button. This button allows you to open or close the devices cover. The following button is Graphs which will display the devices sensor graphs. Next is the Lock/Unlock button that allows you to lock the device which will prevent the device from opening or closing. Use this button when maintenance is taking place or someone is working locally on the device. Lastly you have the Edit button that allows you to edit the devices settings/details.

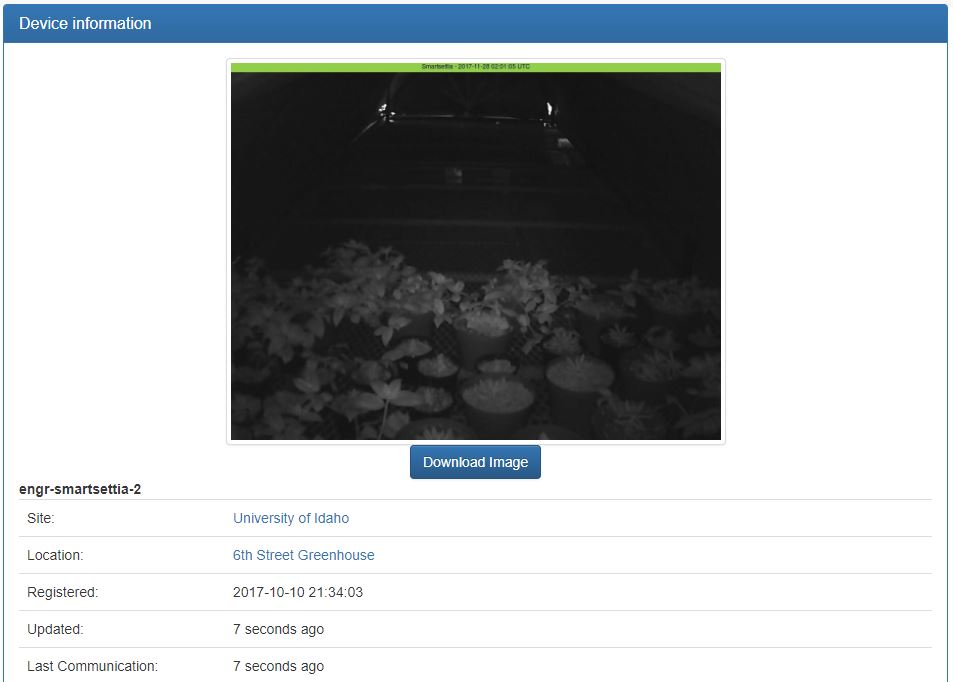
The device information page gives you a detailed look at the selected device’s settings, values, sensor data, and sensor graphs. This page is made up of the three panels containing all of this information and they are the device details panel, sensors panel, and graphs panel. Your assigned role will dictate which actions you can see/perform on the device information page (See role-based access control for more info).
This panel contains all the detailed information about the selected device. This ranges from the device’s current picture to the device’s configured open and close times.
Located at the bottom of the device details panel is a footer that contains three buttons. From left to right you have the Return button that will bring you to the Manage Device Page. Next you have the Edit button that will allow you to edit the device. Lastly you have the Delete button that will allow you to move the device to the trash.

The sensors panel lists all of the sensors that are connected to the selected device. This list contains four columns of details about each connected sensor. From left to right you have the sensors name, the type of sensor, the last value recorded from the sensor, and lastly when the sensor set its last value.

Located beneath the sensors panel is the last panel on the device information page. This panel contains a graph for each sensor connected to the device. The graphs display the average value for each day for the last thirty days.

1a) Go to www.smartsettia.com/register
Or
1b) While on www.smartsettia.com click the Register button on the navigation bar located on the top right of your screen

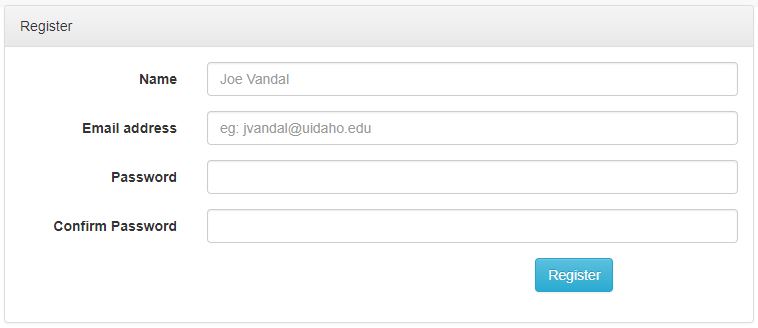
2) Enter your name, email address, a password, and the registration password
Note: Registration password is required to create an account. Contact the site’s owner to gain access.
3) Click the Register button
1a) Go to www.smartsettia.com/login
Or
1b) While on www.smartsettia.com click the Login button on the navigation bar located on the top right of your screen

2) Enter your email address and your password
3) Click the Login button

1a) Go to www.smartsettia.com/dashboard
Or
1b) While on www.smartsettia.com click the Dashboard button on the navigation bar located on the top right of your screen

2) Click on the specific device's name

3) Scroll through all of the available device details on the Device Information Page
1a) Go to www.smartsettia.com/dashboard
Or
1b) While on www.smartsettia.com click the Dashboard button on the navigation bar located on the top right of your screen
2) Click the Open(or Close) button to the right of the specific device you want the action to place on
Note: There is only one button for opening and closing a device. This button will only give you the available option that can be performed.

1a) Go to www.smartsettia.com/dashboard
Or
1b) While on www.smartsettia.com click the Dashboard button on the navigation bar located on the top right of your screen
2) Click the Lock(or Unlock) button to the right of the specific device you want the action to place on
Note: There is only one button for locking and unlocking a device. This button will only give you the available option that can be performed.

1a) Go to www.smartsettia.com/dashboard
Or
1b) While on www.smartsettia.com click the Dashboard button on the navigation bar located on the top right of your screen
2) Click the Graphs button to the right of the specific device

3) Scroll down to the sensor graphs panel
1a) Go to www.smartsettia.com/dashboard
Or
1b) While on www.smartsettia.com click the Dashboard button on the navigation bar located on the top right of your screen
2) Click the View button to the right of the specific device

3) Click the Download Image button located beneath the device's image
