OpenTelemetry: Need to emit two spans (server and client) #11002
Comments
|
This issue is currently awaiting triage. If Ingress contributors determines this is a relevant issue, they will accept it by applying the The Instructions for interacting with me using PR comments are available here. If you have questions or suggestions related to my behavior, please file an issue against the kubernetes/test-infra repository. |
|
/assign @esigo |
|
is your backend instrumented? |
|
@esigo Yes it is, as you can see in the screenshot above, it is called "yasm-backend". I have Frontend (client) -> Ingress-Nginx (server) -> Backend (server), so what I need is something like this |
|
BTW: The Azure Monitor App Insights also needs those two spans. As you can see, the chain
is interrupted. 
|
|
This is stale, but we won't close it automatically, just bare in mind the maintainers may be busy with other tasks and will reach your issue ASAP. If you have any question or request to prioritize this, please reach |
|
I'm also running into this problem, had to disable the traces nginx to make sense of the service graph. |
|
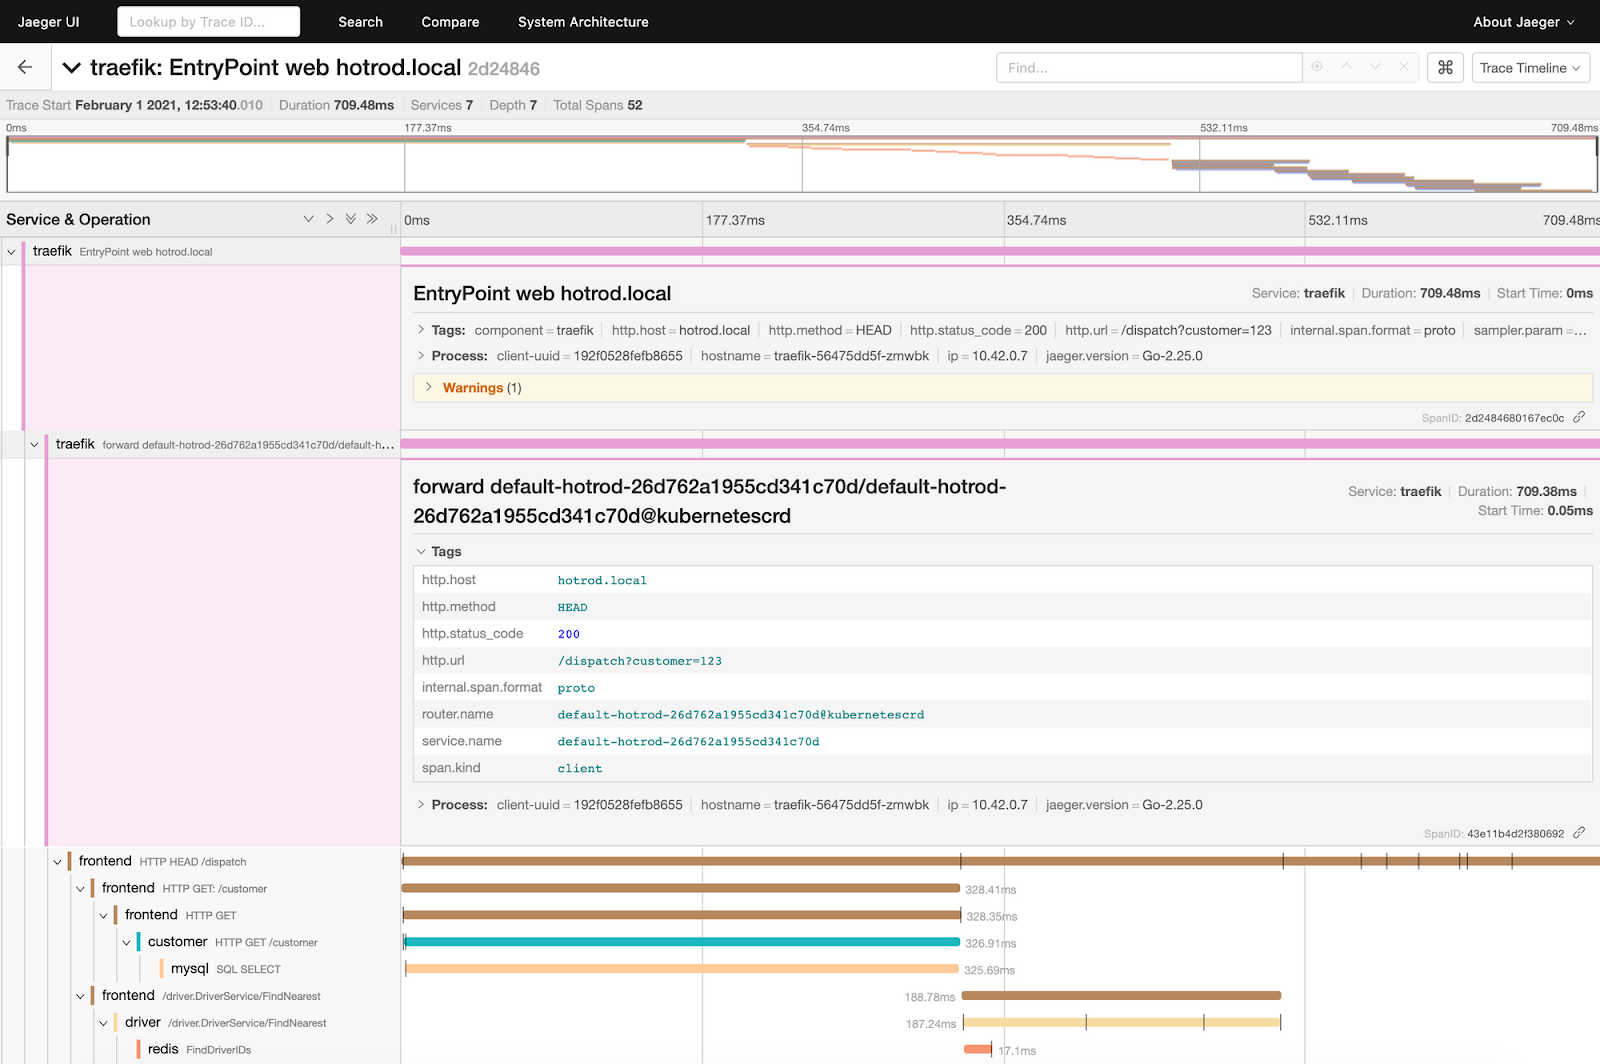
I just saw, that traefik does it correctly like in this sample: The upper one is of type server, the lower one of type span. |
Disabling ingress-nginx in OpenTelemetry brings the problem, that now there is not instance that add span attributes like http.status. Now each micro service needs to do this by its own and this is exactly what I try to avoid. |
What happened:
I am using OpenTelemetry with Ingress-Nginx. This works so far and looks like this in Grafana/Tempo:
The problem is that the Metrics-Generator of Grafana does not work correctly. The Service Graph looks like this:
(ignore the component yasm-proxy-odbc). The Problem is, that there is no direct connection from ingress-nginx to my backend yasm-backend.
What you expected to happen:
According to the Otel Spec the Ingress-Nginx is both a SERVER and a CLIENT to the backend. Therefore it should emit two spans:
Environment:
Azure Kubernetes Service
How was the ingress-nginx-controller installed:
How to reproduce this issue:
Access the Ingress from outside and observe the traces. You will see one span coming from the ingress-controller. It is of type server:
It is of type server. The next trace is of type server as well and this leads to the problem that tracing backends don't handle that correctly. There should be a second span of type client.
The text was updated successfully, but these errors were encountered: