In this case study we use Deep Learning, Recurrent Neural Networks with Long Short-Term Memory(LSTM) layers to predict the price of the Google stock. LSTM is more sophisticated version of RNN which addresses the Vanishing Gradient Problem that RNNs often suffer from. This project is based on the past Google stock prices of the last 5 years corresponding the time period of 2016-2020 that is used to train the RNN model and then use it to predict the upward and downward trends in the stock price of Google on January 2021.
Note that this caase sstuddy is inspired fromthe following Udemy Deep Learning Course:
This Blog , Case Study Paper and Python Code include:
- Recurrent Neural Networks(RNNs)
- RNN Optimization Process
- Vanishing Gradient Descent
- Long Short-Term Memories (LSTMs)
- GRU
- Data Preproocessing
- Training/Testing/Evaluation
- Results
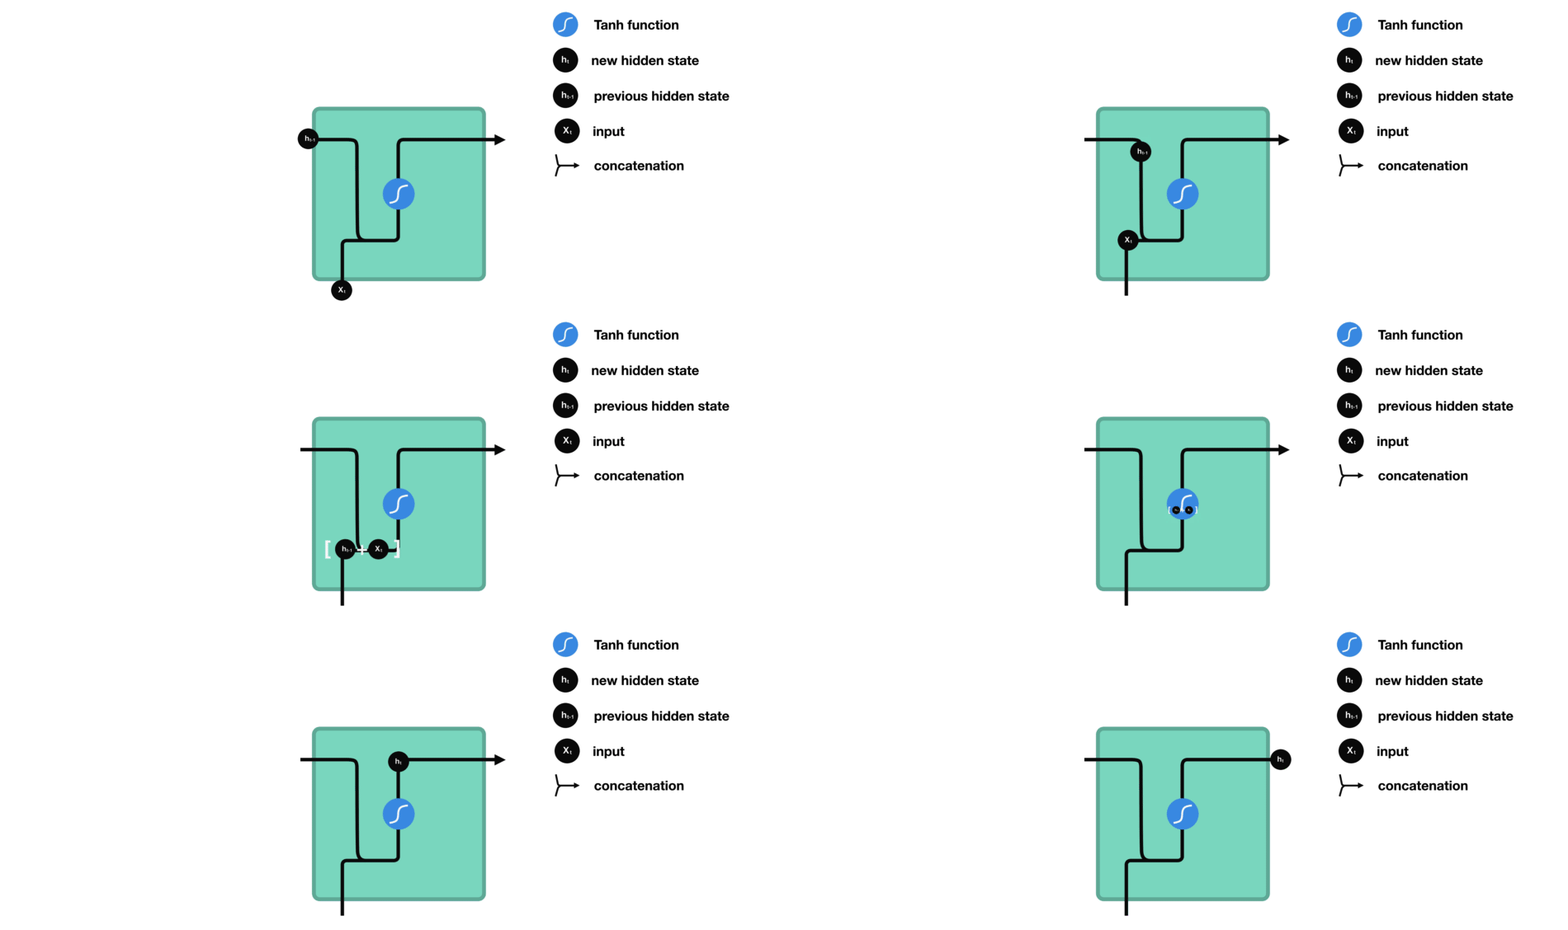
What RNN does is that it translates the provided inputs to a machine readable vectors. Then the system processes each of this sequence of vectors one by one, moving from very first vector to the next one in a sequential order. While processing, the system passes the information through the hidden state (memory) to the next step of the sequence. Once the hidden state has collected all the existing information in the system until time period t, it is ready to move towards the next step and in this newer step the hidden step is classified as previous hidden state defined. Find more detailed description about eache of these processes in the Case Study Paper
Image Source
In the very initial epoch of RNN, the weights are randomly chosen values and in case this chosen values are very small, multiplying them with recurrent weight many times, the gradient becomes less and less and at some point the gradient will vanish because the lower the gradient is, the harder is to update weight which means the slower will be the process. Moreover, there is a domino effect and one improperly calculated weight effects the calculation of the remaining weights and makes them inaccurate as well, given that they all are related. Hence, the entire training of the network will be inaccurate and some part of an important information will be lost in the process and will not be kept in the short-term memory.
LSTMs have the same information flow as usual RNNs with the sequential information transition where data propagates forward through sequential steps. The difference between the usual RNN and LSTM is the set of operations that are performed on the passed information and the input value in that specific step. These set of various operations gives the LSTM the opportunity to keep or forget parts of the information that flows into that particular step. The information in LSTMs flows through its gates which are LSTMs’ main concepts; forget gate, input gate, cell state, and output gate. All these processes are described in Case Study Paper
.
The Hyperbolic Tangent Activation Function (Tanh function) is used because it is one of the activation functions that transforms vectors in such a way that all the elements of this vector fall in the range of [-1,1]. Using this in LSTM we avoid having too large or too small values that are transmitted through the system and cause problems. The Sigmoid function transforms vectors in such a way that all the elements of this vector fall in the range of [0,1] which helps to regulate the network by updating or forgetting data because any number getting multiplied by 0 is 0, causing values to disappear or to be “forgotten” and any number multiplied by 1 is the same value therefore that value stays the same or is “kept”. More about this in Case Study Paper
We have used Google stock price data, publicly available and downloaded from Yahoo Finance. For training the model we have used stock prices for the period of 2016-2020 and used it to predict stock prices for the January of 2021.
You can download the Training Data here
You can download the Test Data here
Google Stock Price Development Graph (Training Data)
In order to prepare the data to train and test RNN model we have performed certain data preprocessing steps using Tensorflow, Keras, Pandas and Scikit-Learn libraries. Detailed info about data preprocessing can be found in Case Study Paper
Comparing the real Google stock values and predicted Google stock values that are generated using RNN model, for the test period, the first month of 2021. RNN based on 5 LSTMs was able to properly predict all upward and downward trends as we see that the red line corresponding to the predicted stock prices follows the same pattern as the blue line which corresponds the real stock prices.
The same method can be applied on different financial instruments such as Bitcoin. Check out an application of this on Bitcoin in my Medium Article called Predicting Bitcoin’s Price With Recurrent Neural Networks
In order to prepare the data to train and test RNN model we have performed certain data preprocessing steps using Tensorflow, Keras, Pandas and Scikit-Learn libraries. Detailed info about data preprocessing can be found in Case Study Blog
Comparing the real Bitcoin price values and predicted Bitcoin price values that are generated using RNN model, for the test period, the first 3 months of 2021. RNN based on 5 LSTMs was able to properly predict all upward and downward trends as we see that the red line corresponding to the predicted stock prices follows the same pattern as the blue line which corresponds the real stock prices.


